The past is often a window into the future. When considering Greenland, we can look back and see what temperature was needed for the Ice in Greenland to melt. This then tells us how close we are to something similar.
A study published in Dec 2019 utilised this strategy, and so we do have an answer to what comes next.
Study: A low climate threshold for south Greenland Ice Sheet demise during the Late Pleistocene
Climate models have been suggesting that the loss of ice mass from the Greenland ice sheet will become irreversible when the temperature threshold is between 0.8 and 3.2 °C.
We don’t need to depend upon climate models. Late Pleistocene interglacials provide potential case examples. This is what the study uses.
What exactly have they done?
The abstract sums it up as follows …
Using high-resolution multiproxy surface ocean climate records off southern Greenland, we show that the previous 4 interglacials over the last ∼450 ka all reached warmer than present climate conditions and exceeded the modeled temperature threshold for GIS (Greenland Ice Sheet) collapse but by different magnitudes and durations. Complete deglaciation of the southern GIS in Marine Isotope Stage 11c (MIS 11c; 394.7 to 424.2 ka) occurred under climates only slightly warmer than present (∼0.5 ± 1.6 °C), placing the temperature threshold for major GIS retreat in the lower end of model estimates and within projections for this century.
Why does knowing this matter?
Greenland is far away and not many people live there, so why should we care?
Complete melting of the Ice Sheet can contribute up to 7 m of global sea-level rise. This is not a suggestion that this will happen overnight. If however we reach a tipping point, then we are in effect committing ourselves to this scenario unfolding.
Looking back the study researchers could see 4 examples of Greenland melt. These contributed 0.4 to 5.6 and 3.9 to 7.0 m, respectively, to sea-level rise above present. That last one appears to be an example of complete deglaciation. Bedrock data suggest that even central Greenland was ice free in one or more recent interglacials.
What exactly is their data source?
Via the Integrated Ocean Drilling Program (IODP) site off southern Greenland that have created high-resolution ocean climate (Sea Surface Temperature) reconstructions. Via such samples then can see the presence of spruce forests and the cessation of Greenland silt discharge. The lack of such silt can be interpreted to reflect complete deglaciation of the southern GIS.
Data Visualisation
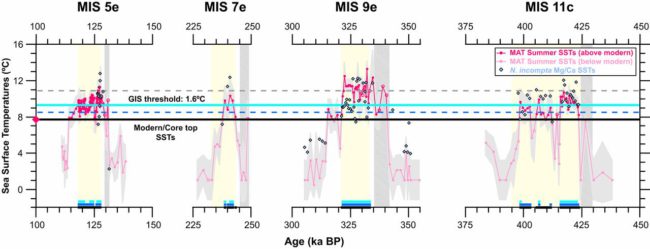
By drilling down far enough they are able to look back over the last 4 interglacials. This has yielding data as follows …

The above illustrates the Ice Sheet thresholds over a timespan of about 450,000 years.
- The pink diamond and the black bold line mark the modern/core top summer Sea Surface Temperature (7.7 °C)
- summer Sea Surface Temperatures above modern temperature are shown in dark pink
- Temperatures below modern temperature are shown in light pink.
- Light gray shading marks the uncertainty
- Open circles mark samples with low (<150) total number of planktonic foraminifera.
- Yellow shading marks the interglacial
- Gray (cross-hatched) shading marks deglacial peaks
- The bold light blue line and the dashed blue and gray lines mark the modeled global mean temperature threshold for the Ice Sheet collapse (1.6 °C) and its range (0.8 to 3.2 °C), respectively
- Black, dark blue, and light blue bars (along the bottom) mark the durations of summer Sea Surface Temperatures above modern, 0.8 °C threshold, and 1.6 °C threshold, respectively.
What does it mean for us?
A low Ice Sheet threshold increases the plausibility that one of the most economically impactful long-term consequences of warming could be passed well below the 2 °C threshold and may already be unavoidable if even modestly warmer conditions were to persist long enough.
Study Author comments
University of Bergen paleoclimatologist Ulysses S. Ninnemann, a co-author of the study…
“Our best estimate suggests that modest warming was able to dramatically reduce the parts of the Greenland Ice Sheet that are hard to melt away,” Ninnemann said. Areas of the ice sheet thought to be relatively stable, including the high-elevation southern and southeastern sections, could melt “due to only a small increase in temperatures relative to today,“
…”What is interesting is that, despite periods of cooling in between, it looks like the ice still went away, which suggests that a threshold might have been crossed—after enough melting had occurred—at which point the loss of large amounts of ice became inevitable.”…
…”Some parts of the climate system respond slowly so that the fact that we don’t yet see major consequences doesn’t mean that major consequences are not in the pipeline and may be inevitable,” he said. The study shows that the length of the warming period is critical, if we can limit the time the global temperature stays above the threshold for melting, there’s a chance the ice sheet could stabilize, he said….
…”The geologic record holds the answers to how climate operated in a warmer world,”…
Greenland Ice Sheet – Further Reading
- Study (23-Dec-2019) PNAS – A low climate threshold for south Greenland Ice Sheet demise during the Late Pleistocene
- Inside Climate News dug into the study (23-Dec 2019) – Greenland’s Nearing a Climate Tipping Point. How Long Warming Lasts Will Decide Its Fate, Study Says
