A medical intervention brings both potential harm as well as a benefit. When considering any treatment, you need to consider both.
Truly understanding this ratio can become very complicated.
The Astra-Zeneca vaccine, the most commonly used one in the UK, has a potential link to a specific kind of blood clot. The MHRA data point to these specific blood clots being more common in younger people.
Flip the coin over and consider the benefits. There we find these variables …
- How likely is it for you to be exposed to the virus (e.g. how prevalent the virus is, locally, at the time; what your occupational exposure is to it).
- The greater the potential exposure the greater the benefit for the vaccine.
- How likely are you to have a poor outcome as a result of catching the virus?
- Both your age and also the existence of underlying health conditions need to be considered. Both play a huge role in the outcome.
Crunching the Numbers
Researchers at the University of Cambridge have used data to measure both the benefits and also the potential harm of the AZ vaccine …
For the potential benefit: incidence rates based on the Covid-19 Infection Survey, ONS, 1 April 2021. The proportion of hospitalisations in a cohort was calculated using the estimates of COVID-19 hospitalisation rates associated with the 10-year age cohorts studied. These estimates were taken from Table 1 of the 29 July 2020 report of the Scientific Pandemic Influenza Group on Modelling, Operational sub-group (SPI-M-O). The proportion of ICU cases to hospitalisations was calculated using the PHE Benefit Estimation for COVID-19 Report from 3 April 2021 which gave more recent ICU figures than the July 2020 report – the proportion of COVID-19 patients going into ICU has fallen as treatments have improved. The 10-year age cohorts were determined by weighted averages if not directly available. A fixed vaccine efficacy of 80% for all age groups for ICU reduction was used.
For the potential harms: numbers of cases of the blood clot reactions provided by MHRA up to March 31st in five-year age-bands. These observed rates were smoothed using a Poisson regression on age, with log-link.
What they have then done is to create three graphics that illustrate their results.
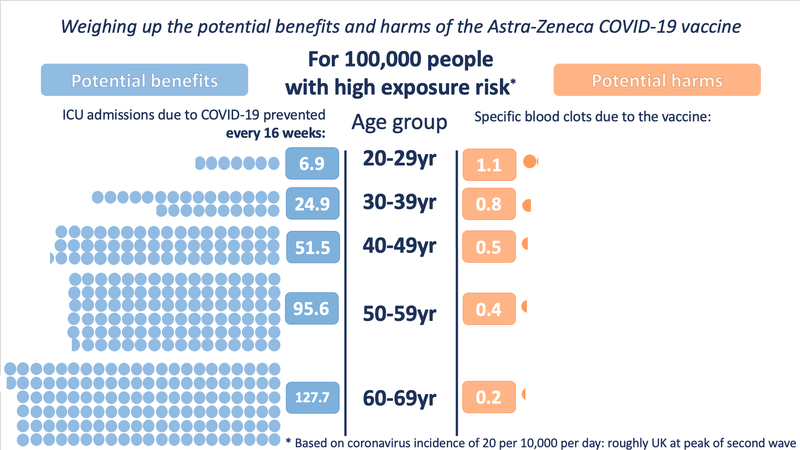
Just before we jump in, let’s make one point crystal clear. What they are showing in blue on the left is simply the number of people saved from going into the ICU due to COVID-19. For every 1 person shown as being saved from ICU admission, there are many more who might be being saved from suffering hospitalization and ‘long COVID’. They don’t illustrate that below. Nor are they illustrating the benefit of not spreading the virus to others.
In other words, beyond what is in blue (not going to ICU), there is also a great deal more benefit granted by having the vaccine. The comparison below simply measures the benefit of not going to ICU because you had the vaccine vs the risk of the vaccine causing a blood clot.
Chart 1 – Low Exposure – 2 in every 100,000 exposed per day
This is roughly the UK in March 2021.
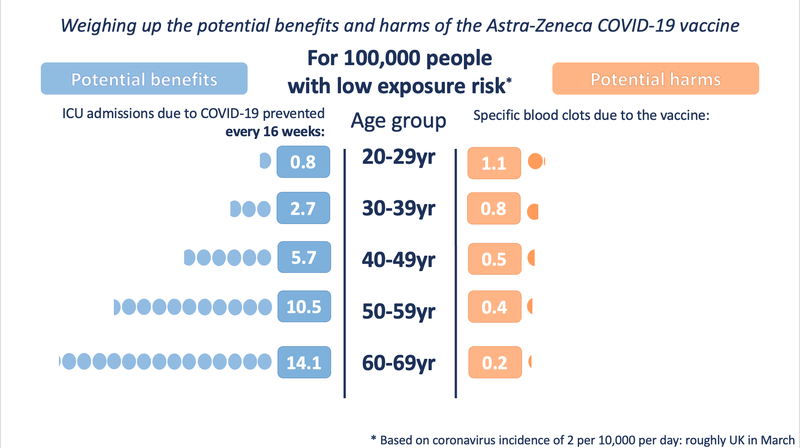
Chart 2 – Medium Exposure – 6 in every 10,000 exposed per day
This is roughly the UK in February 2021 …
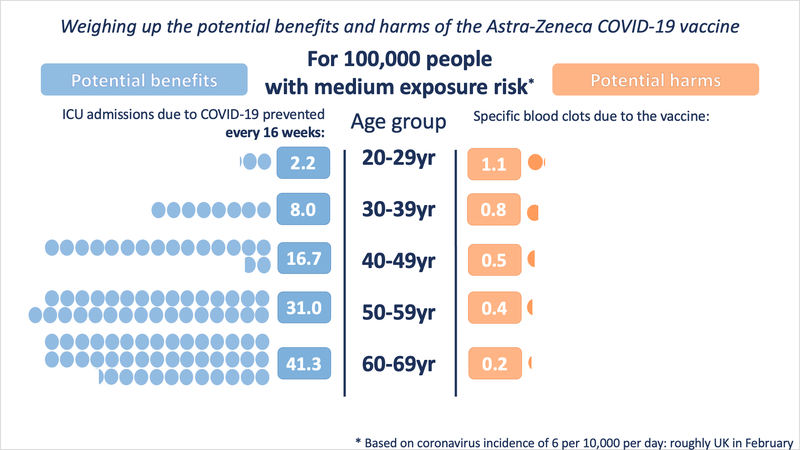
Chart 3 – High Exposure – 20 in every 10,000 exposed per day
This is roughly the UK at the height of the second wave …
Summary – It’s complicated
The point here is that there is no simple binary choice. Instead we have lots of variables.
All of these factors make any decision over the Astra-Zeneca vaccine a complex one – the risk:benefit ratio varies between different people, and as prevalence of the virus changes
One other point to note is this. A vaccinated person will keep accruing this benefit over the lifetime of the vaccine’s protection. The risk from vaccination occurs only at the point of vaccination.
Further Reading
University of Cambridge – Communicating the potential benefits and harms of the Astra-Zeneca COVID-19 vaccine
