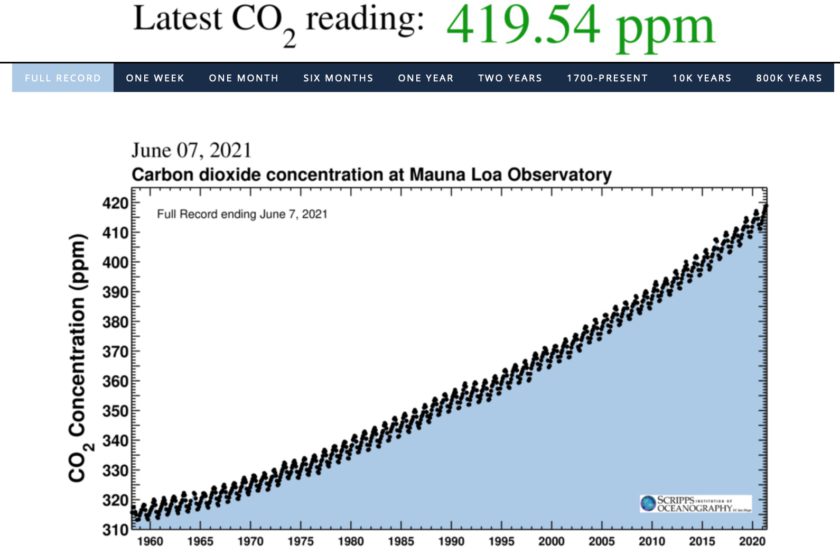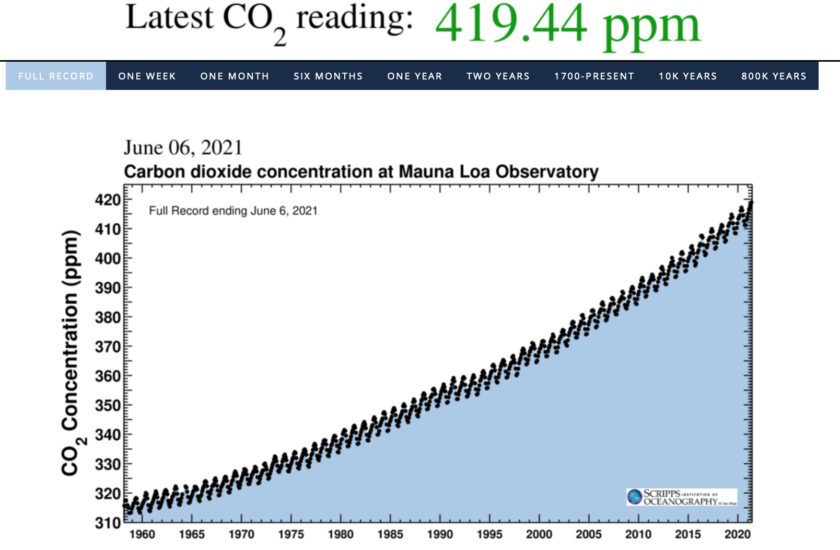
For over the last 63 years atmospheric carbon dioxide (CO2) has been very precisely measured at Mauna Loa Observatory. They have just issued (June 2021) a press release to announce that we are near 420 ppm, a record level. These levels are the highest since accurate measurements began.
This is a Big Deal
The Press Release makes this rather obvious point …
“The ultimate control knob on atmospheric CO2 is fossil-fuel emissions,” said Scripps geochemist Ralph Keeling, who took over the measurement series named the Keeling Curve after his father’s death in 2005, “but we still have a long way to go to halt the rise, as each year more CO2 piles up in the atmosphere. We ultimately need cuts that are much larger and sustained longer than the COVID-related shutdowns of 2020.”
In other words, despite the global shutdown due to COVID, the CO2 levels still continue to rise. There has in fact been no discernible signal because of the shutdown. If curious to understand why, then the NOAA Global Monitoring Laboratory explains it.
Why has COVID-19 Lockdown not had an impact?
The reason is that the drop in emissions would need to be large enough to stand out from natural CO2 variability, caused by how plants and soils respond to seasonal and annual variations of temperature, humidity, soil moisture, etc. These natural variations are large, and so far the emissions reductions associated with COVID-19 do not stand out. If emissions reductions of 20 to 30 percent were sustained for six to 12 months, then the rate of increase of CO2 measured at Mauna Loa would be slowed.
What are we doing?
Hitting 420 ppm is a landmark moment. It is not simply a first in the last 63 years, it is a first in the last one million years at least.
“We are adding roughly 40 billion metric tons of CO2 pollution to the atmosphere per year,” said Tans. “That is a mountain of carbon that we dig up out of the earth, burn, and release into the atmosphere as CO2 – year after year. If we want to avoid catastrophic climate change, the highest priority must be to reduce CO2 pollution to zero at the earliest possible date.”
Beyond the above, they also spell it all out in very stark terms like this …
The atmospheric burden of CO2 is now comparable to where it was during the Pliocene Climatic Optimum, between 4.1 and 4.5 million years ago, when CO2 was close to, or above 400 ppm. During that time, sea level was about 78 feet higher than today, the average temperature was 7 degrees Fahrenheit higher than in pre-industrial times, andstudies indicate large forests occupied areas of the Arctic that are now tundra.
The point they are making is this. Now that we have those levels of CO2 emitted, we are more or less committed long-term to a far warmer world and a greatly accelerated rate of sea level rise.
It is not all doom and gloom, we still have choices. If we can rapidly switch away from CO2 emissions then we can potentially slow things down. That means that instead of drastic changes in a very short period of time, it all unfolds over far longer periods of time. That then gives us time to adapt to the changes. If it all happens too quickly, then we will not be able to adapt fast enough.
The Movie
If you don’t want to read all the words, then here is the movie. It is just one minute long and places the current reading in the context of the big picture …
How are global CO2 emissions measured?
Far from any city, measurements are taken at the Mauna Loa Observatory on the island of Hawaii. This has been done from 1958 to the present day. The Mauna Loa observatory is a benchmark sampling location for CO2. Perched on a barren volcano in the middle of the Pacific Ocean, the observatory is ideally situated for sampling well-mixed air that is undisturbed by the influence of local pollution sources or vegetation. This location represents the global background for the northern hemisphere.
The measured curve is known as the Keeling curve because scientist Charles David Keeling, started the monitoring program and supervised it until his death in 2005. Since his passing, responsibility and oversight of the project was transferred to Keeling’s son, Ralph Keeling. On the fiftieth anniversary of the beginning of the project, the younger Keeling wrote an article in Science magazine describing his father’s life and work, along with how the project has grown and evolved over time. Along with more precise measurement materials and funds for the project of monitoring of the Earth’s CO2 levels, Keeling wrote his pride for his father’s work and how he has continued it in his memory.
One last point
We still have a choice. To make that point I’ll finish with a quote from Pieter Tans. He is a senior scientist with NOAA’s Global Monitoring Laboratory …
“The solution is right before our eyes. Solar energy and wind are already cheaper than fossil fuels and they work at the scales that are required. If we keep stalling like we have done, then it will be too late.”
We might indeed be tempted to simply do nothing, but “Doing Nothing” is no longer an option. You might think you have no options, but actually you do. Who did you vote for in the last election and where do they stand on this issue?
In the long term this is the definitive existential issue for our species, everything else pales into insignificance when stacked up beside it.
CO2 at 419ppm – Further Reading
- The Keeling Curve Wikipedia page
- The Official site where you will find the daily readings
- Scripps Institution of Oceanography and NOAA Press release (June 7, 2021) – CORONAVIRUS RESPONSE BARELY SLOWS RISING CARBON DIOXIDE
