 The news is out and many are reporting the details. Richard Black writes on the BBC …
The Earth’s surface really is getting warmer, a new analysis by a US scientific group set up in the wake of the “Climategate” affair has concluded.
The Berkeley Earth Project has used new methods and some new data, but finds the same warming trend seen by groups such as the UK Met Office and Nasa.
So what do the climate change sceptics make of all this? Well, if we stop over at the telegraph and see what everybody’s favorite climate change denier is saying, it should be no surprise to find that he declares it all bullshit and explains, “I’m not a climate scientist. What I am is someone eminently more qualified to deconstruct the semantic skullduggery going on here: a student of language, rhetoric and grade one bullshit.” then goes on to babble some nonsense. What is interesting is that one year ago he was insisting that global cooling was real, but does now admit in this latest article that global warming is real …
“….the global elite is perfectly well aware that global cooling represents a far more serious and imminent threat to the world than global warming, but is so far unwilling to admit it except behind closed doors.“
[James Delingpole, September 26th, 2010: http://blogs.telegraph.co.uk/n… ]
“Global warming is real“
[James Delingpole, October 21st, 2011: http://blogs.telegraph.co.uk/n… ]
Confused? He sure is. Hint: the clue is in his declaration that he is not a climate scientist.
Anyway, moving on.
The latest report has come from a project established by University of California physics professor Richard Muller. He was concerned by claims that established teams of climate researchers had not been entirely open with their data, so he gathered a team of 10 scientists, mostly physicists. They located about 40,000 weather stations around the world whose output has been recorded and stored in digital form, then developed a new way of analysing the data to plot the global temperature trend over land since 1800.
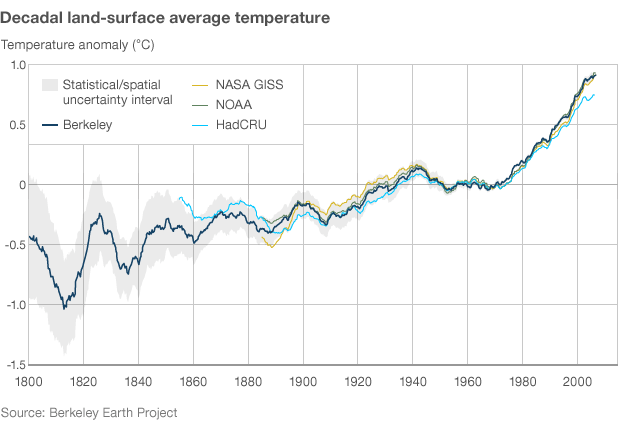
What came out was a graph remarkably similar to those produced by the world’s three most important and established groups, whose work had been decried as unreliable and shoddy in climate sceptic circles. Here is their graph …
The above chart shows the decadal land-surface average temperature using a 10-year moving average of surface temperatures over land. Anomalies are relative to the Jan 1950 – December 1979 mean. The grey band indicates 95% statistical and spatial uncertainty interval.
Two of those three are maintained in the US, by the National Oceanic and Atmospheric Administration (Noaa) and National Aeronautics and Space Administration (Nasa). The third is a collaboration between the UK Met Office and UEA’s Climatic Research Unit (CRU), from which the e-mails that formed the basis of the “Climategate” furore were hacked two years ago.
“Our biggest surprise was that the new results agreed so closely with the warming values published previously by other teams in the US and the UK,” said Prof Muller.
“This confirms that these studies were done carefully and that potential biases identified by climate change sceptics did not seriously affect their conclusions.”
Since the 1950s, the average temperature over land has increased by 1C, the group found.
They also report that although the urban heat island effect is real – which is well-established – it is not behind the warming registered by the majority of weather stations around the world.
You would think that now is a good time for the so-called ‘sceptics’ to drop their thoroughly discredited claims, but if Mr Delingpole’s babblings are anything to go by, you can be sure that will not be happening.
Meanwhile, work continues for the Berkley team, they plan to look at ocean temperatures next, in order to construct a truly global dataset.
Links
- BBC News article
- The Berkeley Earth Project
- The paper on Berkeley Earth Temperature Averaging Process which describes the mathematical averaging process underlying the Berkeley Earth project approach that allows them to include short and discontinuous temperature records
- The Berkeley Earth data set is now publicly available here.
- The Berkeley Earth analysis programs are now publicly available here.
- Summary charts, using all of the available data, are here.
- A video showing the Berkeley Earth land temperature anomaly is here.
