The HadCRUT global temperature data set has been refined and revised. HadCRUT version 5 is now available. This is one of the main Climate Change datasets.
What exactly is HadCRUT?
It a long-running collaboration between the Met Office Hadley Centre (Had) and the Climatic Research Unit (CRU) at the University of East Anglia. That is of course why it is named HadCRUT.
What it consists of are the sea surface temperature records compiled by the Hadley Centre of the UK Met Office and the land surface air temperature records compiled by the Climatic Research Unit (CRU) of the University of East Anglia.
The data is structured as a grid of boxes and covers the entire globe. Values for each box consist of temperature observations in a particular month and year.
What Revise it?
Often there are gaps. Gaps within boxes for specific periods leads to a gap in our understanding of the big picture. Obviously time also moves forward and new data is collected, so that needs to be added.
What is New in HadCRUT5?
They have improved the way that marine instrument changes are dealt with and, for the first time, they used statistical methods to provide an improved analysis that extends the coverage in data sparse areas.
What remains consistent?
None of these improvements affect the broad scale conclusions.
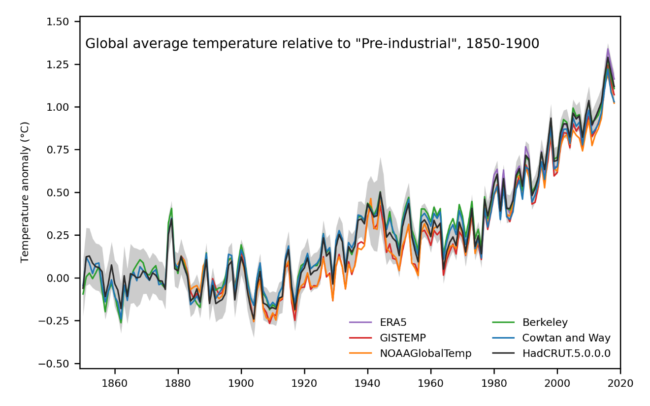
Long-term warming is still clearly evident at a global scale – in line with other data sets – and the four years 2015 to 2018 are the warmest in the series, which at the time of publication runs from 1850 to 2018.
What new insights do the latest changes bring?
The overall warming from the start of the record is slightly larger than was estimated from HadCRUT version 4.
Does it align with other independently created datasets?
One word answer – yes.
Here is a diagram to illustrate that …

Tell me more about this slight increase – How did that come about?
The slight increase in estimated long-term warming has two main causes.
- The first is that they improved how they deal with changes in the way that sea-surface temperatures were measured, using higher-quality measurements as a reference.
- The second is that increasing the coverage – by drawing on a larger database of observations and using statistical methods – means they get a more balanced estimate of global temperature change.
Explaining the Sea Surface changes
The improvements to the sea-surface temperature data were published last year. They used data from research cruises and other oceanographic measurements to calculate the offsets between measurement methods and to work out which methods were being used at different times and places.
They found that more ships were measuring sea-surface temperature in their engine rooms than was previously thought. Measurements made in the engine room use water drawn in below the surface but tend to report temperatures that are slightly too high due to warming of the water in the pipework and warm environment of the engine room. This artificial warming effect has diminished over time. It has the largest effect around the end of the 1970s when the warm bias and the global fleet were both changing fast.
They still have gaps
While they have improved the data set, it is by no means perfect. There are still major data gaps, particularly in the 19th Century. Systematic and regular monitoring of Antarctica did not start until the late 1950s, so there is a persistent data void at high southern latitudes before then. Digitization of paper records is needed to fill as many of the remaining blank spaces in the map as possible.
Uncertainties remain, particularly uncertainties associated with corrections for the effect of changing measurement methods that affect temperature records on the longest time scales.
HadCRUT5 should be considered alongside other data sets, such as GISTEMP (produce by the NASA Goddard Institute for Space Studies), NOAAGlobalTemp, Berkeley Earth and dynamical reanalyses, to get a better understanding of near and long-term change and its uncertainties.
What are the implications, the new insights, from HadCRUT5?
The average global temperature for 2010-2018 is 1.07 ± 0.11 °C warmer than average conditions in 1850-1900.
This is 0.16 °C more than in the previous version of the data set.
The previous version, HadCRUT4, showed less warming than other global temperature data sets. HadCRUT5 is now more consistent with these other datasets during recent decades and shows slightly more warming than most of them do over the full period since 1850.
Quotes from the joint Press Release
“Each of the main global temperature datasets, including those by NOAA and NASA, are compiled separately using different methods, but each is based on a finite amount of global temperature observations. The range of approaches results in very similar estimates of overall warming and provides scientific confidence in the changes seen and also reinforces the fact that the world has warmed considerably since the mid nineteenth century.”
Dr. Colin Morice of the Met Office
“We made our first estimate of global warming in 1986 and since then we have regularly improved our data and refined our analysis. This new major update to our global temperature record sees the estimate of global warming from 1850 to 2018 revised upwards, from 0.91 to 1.07 °C. Climate change has not suddenly got worse: instead, we have an improved estimate of how much warming has taken place.”
Prof Tim Osborn, Director of Research at the University of East Anglia’s Climatic Research Unit (CRU)
Further Reading
The content of this posting has been sourced from materials provided by the Met Office – here.
The associated Press Release can be found here.
You can find the HadCRUT5 datasets via here, it is freely available. You can find everything there.
