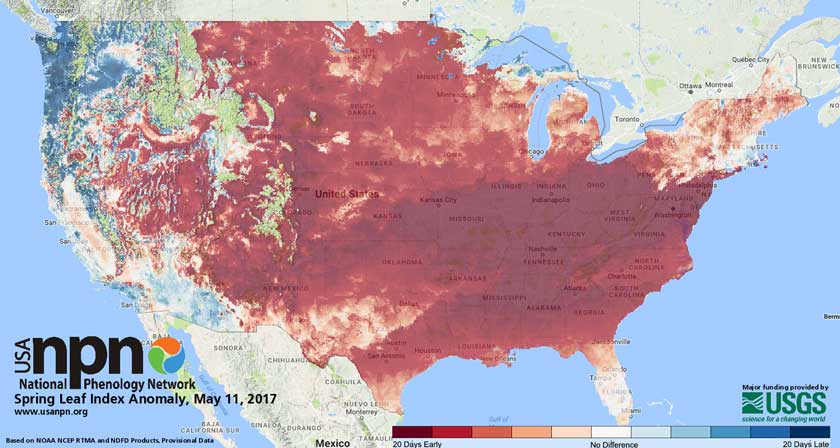
Back last March I had a posting about spring 2017 being very very early in the US. It is now May and so it is appropriate to check back in with the USA-NPN (USA National Phenology Network) and see how things have been blossoming since then.
Side Note: “Phenology” is tracking the dates of biological events in their annual cycle. For example the emergence of leaves and flowers in spring, nesting of birds, etc.. The USA-NPN is an organisation that crowd sources that data, collects it all up and then publishes it in real time.
So how did things progress?
Last March was not a blip, as things unfolded everything in the South east, was up to three weeks early …
 In 2017, we see very large anomalies in the southeastern United States on the Spring Leaf Index map, where the Index was met up to three weeks earlier than what is typical (1981-2010) for these locations.
The timing of leaf-out, migration, flowering and other seasonal phenomena in many species is closely tied to local weather conditions and broad climatic patterns. The Spring Index maps offered by USA-NPN shed light on plant and animal phenology, based on local weather and climate conditions.
Comparing Spring 2017 with other years
The USA-NPN website has a webpage that covers this …
March 20th is the Spring Equinox, which marks the official start of spring on your calendar. This year, the biological start of spring occurred much earlier than average in a large part of the Great Basin, Great Plains, Midwest, and mid-Atlantic. Spring also arrived 2-3 weeks early across much of the South, although it typically has arrived by March 20th …. In the Great Basin and central Great Plains, spring arrived even earlier than 2012, a recent year with a very early start to spring. In Midwest states such as Iowa, Illinois, and Michigan, spring this year is arriving early, but not as early as in 2012.
Who funds all this data gathering?
It is basically volunteers who have an interest in doing this, and so they freely give their time to gather the data. As for the USA-NPN itself, that is funded by several organizations who have a very specific common interest in the gathering of such data. This includes the U.S. Geological Survey, U.S. Fish & Wildlife Service, National Park Service, The University of Arizona, and the National Science Foundation.
Who Uses their data?
The data itself is interesting, but does anybody actually use it?
In essence, yes of course …
- In the National Climate Assessment, primarily in the section on Seasonal Patterns in the Biodiversity Chapter.
- In the Global Change Information System, an ongoing information portal for key indicators in the National Climate Assessment.
- In the EPA’s 2016 Climate Change Indicators Report.
- To document trends in National Park units
Further USA-NPS Links
- You can find a bit of USA-NPN history here
- Their Facebook page is here
- Their scientific approach is described here
- They explain why this all matters, and also invite you to join them by gathering data in your yard.
Tweets
Climate change is unraveling natural cycles in the West – https://t.co/6e1o2WuD6g @highcountrynews #phenology #USANPN
— Theresa Crimmins (@TheresaCrimmins) May 11, 2017
Environment Educators can use #USANPN data, lessons & visualizations to teach about #phenology https://t.co/2wJ3jCFLSk @TheresaCrimmins https://t.co/C4G9DORtEA
— Dave Moore (@DJPMoore) April 27, 2017
National #Phenology Database Hits 10M Records https://t.co/dSZuzJ8sNc @UofA @UASNRE @UACALS #USANPN
— Theresa Crimmins (@TheresaCrimmins) April 24, 2017
Spring came early – now pollen season is here with a vengeance https://t.co/eUNQ1FXsFM via @todayshow #USANPN
— Theresa Crimmins (@TheresaCrimmins) April 5, 2017
