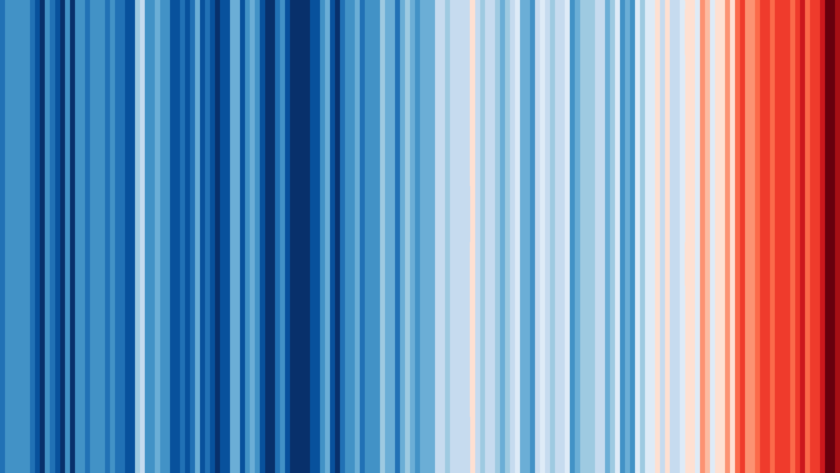
Communicating truly complex concepts in a simple way is to be truly applauded, and #ShowYourStripes does just that. Climate change sounds easy, and so you might attempt to articulate it by explaining that our greenhouse gas emissions are causing the world to get warmer. In reply, somebody might point out that the weather is always changing. So, how should you respond to that?
Pictured above are the Annual global temperatures from 1850-2017. What looks like a stripped flag is a graphic where you have a composite containing a stripe for each year, and the colour of the stripe is a visual representation of the global temperature for that year.
What instantly becomes apparent and obvious is that the world is indeed warming. There are of course many other powerful ways of explains this visually ….
What exactly is #ShowYourStripes day?
Today, on June 21st, meteorologists from around the world will engage in #MetsUnite. The big idea here is that they will #ShowYourStripes via Ed’s one simple graphic.
Is this an effective way to communicate what is happening?
Yes it is …
It sounds like an easy and obvious step for TV Meteorologists, but to get here it is worth understanding that there is a bit of history. As explained by Climate Scientist Marshall Shepherd in Forbes …
While it may seem like a no-brainer for television meteorologists to discuss climate change, it has been an evolving process. Broadcast meteorologists are the only scientists many people encounter daily, yet many colleagues in that sector of the field have been hesitant to engage on climate change (Yes, seriously!). Studies have shown that this is related to many factors: fear of alienating audiences, uncertainty about their own knowledge of climate change, and personal ideology. In recent years, this trend is starting to change. A 2017 study by researchers at George Mason University found that 89% of weathercasters believe their viewers are interested in local impacts of climate change. The same study also found that 80% of weathercasters are convinced of human caused climate change. This is a dramatic shift from previous studies.
Why is there a shift? There are likely many reasons. For example, easier access to climate information relevant to daily weather presentation has been a game change, and Climate Central’s program Climate Matters is likely a key factor. The program provides market-specific and television-ready climate information for weathercasters. From my perspective, another key reason is that changing climate is happening and attribution studies increasingly show linkages to some contemporary extreme weather events. The recent oppressive heat waves in parts of India and the Middle East are likely examples. I also think colleagues are realizing that it is an absolute myth that viewers, even in conservative markets, won’t watch if meteorologists talk about climate change. There is very little evidence supporting that claim. In fact, many of the “most watched” meteorologists in conservative states (Jim Gandy-South Carolina (recently retired), John Morales-Florida, Amber Sullins-Arizona, Greg Fishel-North Carolina (recently retired)) routinely talk about climate change.
The #ShowYourStripes Website
There is an interactive website – https://showyourstripes.info … and there is an associated article from Lifehacker illustrating how to use it.
There on this interactive website you can pick a specific location and generate a unique representation for it. You can also find specific regional variations on Ed’s website here.
What you might then discover is that different regions have different scales. Records for Alaska only go back to 1901, but records for Oxford in the UK stretch right back 1814, and so this is the Oxford data …
People are having a bit of fun with #ShowYourStripes
There are of course other ways to tell the same story
Spirals … also from Ed.
And also dating to 2016, the xkcd timeline …
