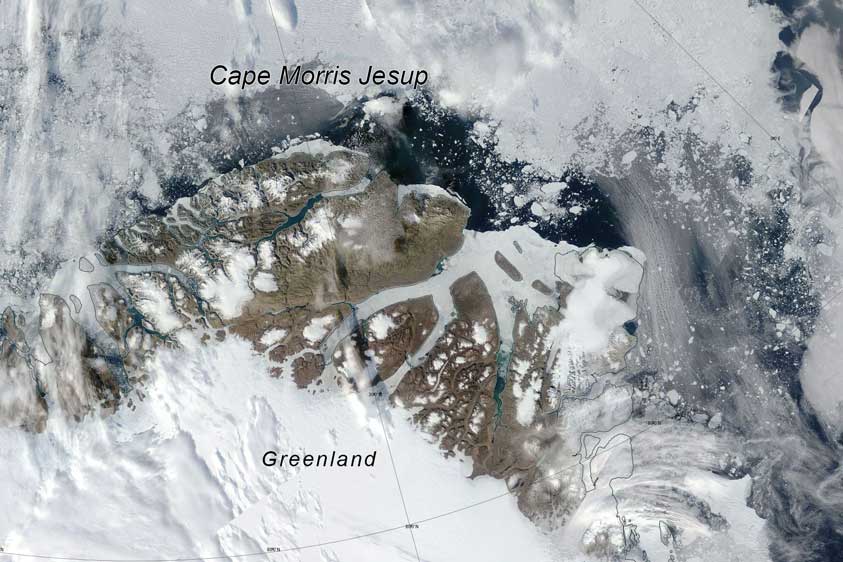
The UK’s Guardian reports on something that has never been seen before this year. The sea ice north of Greenland normally does not break up even in the summer melt season. This year it has been different. They describe it as follows …
This phenomenon – which has never been recorded before – has occurred twice this year due to warm winds and a climate-change driven heatwave in the northern hemisphere.
One meteorologist described the loss of ice as “scary”. Others said it could force scientists to revise their theories about which part of the Arctic will withstand warming the longest.
The sea off the north coast of Greenland is normally so frozen that it was referred to, until recently, as “the last ice area” because it was assumed that this would be the final northern holdout against the melting effects of a hotter planet.
But abnormal temperature spikes in February and earlier this month have left it vulnerable to winds, which have pushed the ice further away from the coast than at any time since satellite records began in the 1970s.
The satellite image below comes via the National Snow and Ice Data Center. It shows a true color composite image of Cape Morris Jesup off of northern Greenland, taken by the Moderate Resolution Imaging Spectroradiometer (MODIS) sensor on the NASA Terra satellite on August 13, 2018. That area of open ocean normally consists of thick, consolidated ice from a general pattern of on-shore ice motion. Even when winds blow offshore, the strength of the thick ice would hold in place along the coast. However, current ice conditions appear more broken up and likely thinner, and over the past couple of weeks, offshore winds have succeeded in pushing ice off of the coast.
In Context
This is not a simple note about ice melting, it’s a bit more complex. The Kap Morris Jesup weather station normally records temperatures that are well below freezing. Twice this year temperature spikes that raise the temperature above freezing have been recorded, and both times, gaps in the sea ice have opened up.
Higher temperatures unlocks the ice from the coast. This then enables strong southerly winds to push it offshore and so the gaps open up.
The even bigger picture here is that this is just one data point that is part of an ongoing longer term trend. Below is an image of the current Arctic sea ice extent. Also marked on that same illustration is where the ice used to be. Arctic sea ice extent was 5.7 million square kilometers (2.2 million square miles). This is 1.58 million square kilometers (610,000 square miles) below the 1981 to 2010 average.
This year is not the lowest extent ever recorded (that was in 2012), but look back over all the years and you will see a clear downward trend that is ongoing.
Tweets
So the open water / low concentration patch North for Greenland is still there (and slowly moving westward). Nice and scary. From https://t.co/jPx1JmNayA https://t.co/hGstLYafcW
— Thomas Lavergne (@lavergnetho) August 13, 2018
Sea ice extent on the Atlantic side of the #Arctic has reached a new all-time record low for the region (combined Barents-Kara-Greenland Seas). Each line shows one year from 1979 (purple) to 2017 (white). The previous record was just last year.
[Daily data is from the @NSIDC] pic.twitter.com/gYrUOLgXb4
— Zack Labe (@ZLabe) August 21, 2018
Thick Arctic Sea Ice Near Greenland Has Broken Up for the First Time in History — https://t.co/YWSb98WSIB pic.twitter.com/kGX92gq6u2
— Mental Floss (@mental_floss) August 21, 2018
Interesting connection between paleo-climate and remote sensing this week up in North Greenland…
First, @ZLabe shows some recent MODIS data:https://t.co/8rbS1xnTlR
— Gavin Schmidt (@ClimateOfGavin) August 21, 2018
The open water situation north of #Greenland. Check a pair of new @dmidk mosaic pictures from Sentinel-1 and Aqua Modis. pic.twitter.com/hb1tzRQFvg
— John Cappelen (@JohnCappelen) August 16, 2018
